> ## Documentation Index
> Fetch the complete documentation index at: https://wb-21fd5541-style-guide-models-tables-20260604-114339.mintlify.site/llms.txt
> Use this file to discover all available pages before exploring further.
> Explore how to use W&B Tables with this 5-minute Quickstart.
# Tutorial: Log tables, visualize, and query data
export const ColabLink = ({url}) =>
Try in Colab
;
Learn how to log data tables to W\&B, visualize them in your project workspace, and compare results across runs. By the end, you’ll have a logged table that you can explore and compare in W\&B.
Select the button below to try a PyTorch Quickstart example project on MNIST data.
## Log a table
In this step, you create a table and log it to W\&B so that it's available for visualization later in the walkthrough. You can either construct a new table or pass a pandas DataFrame.
To construct and log a new table, use the following:
* [`wandb.init()`](/models/ref/python/functions/init): Create a [run](/models/runs/) to track results.
* [`wandb.Table()`](/models/ref/python/data-types/table): Create a new table object.
* `columns`: Set the column names.
* `data`: Set the contents of each row.
* [`wandb.Run.log()`](/models/ref/python/experiments/run.md/#method-runlog): Log the table to save it to W\&B.
Here's an example:
```python theme={null}
import wandb
with wandb.init(project="table-test") as run:
# Create and log a new table.
my_table = wandb.Table(columns=["a", "b"], data=[["a1", "b1"], ["a2", "b2"]])
run.log({"Table Name": my_table})
```
Pass a pandas DataFrame to `wandb.Table()` to create a new table.
```python theme={null}
import wandb
import pandas as pd
df = pd.read_csv("my_data.csv")
with wandb.init(project="df-table") as run:
# Create a new table from the DataFrame
# and log it to W&B.
my_table = wandb.Table(dataframe=df)
run.log({"Table Name": my_table})
```
For more information on supported data types, see the [`wandb.Table`](/models/ref/python/data-types/table) in the W\&B API Reference Guide.
## Visualize tables in your project workspace
After logging a table, you can view it in W\&B.
1. Navigate to your project in W\&B.
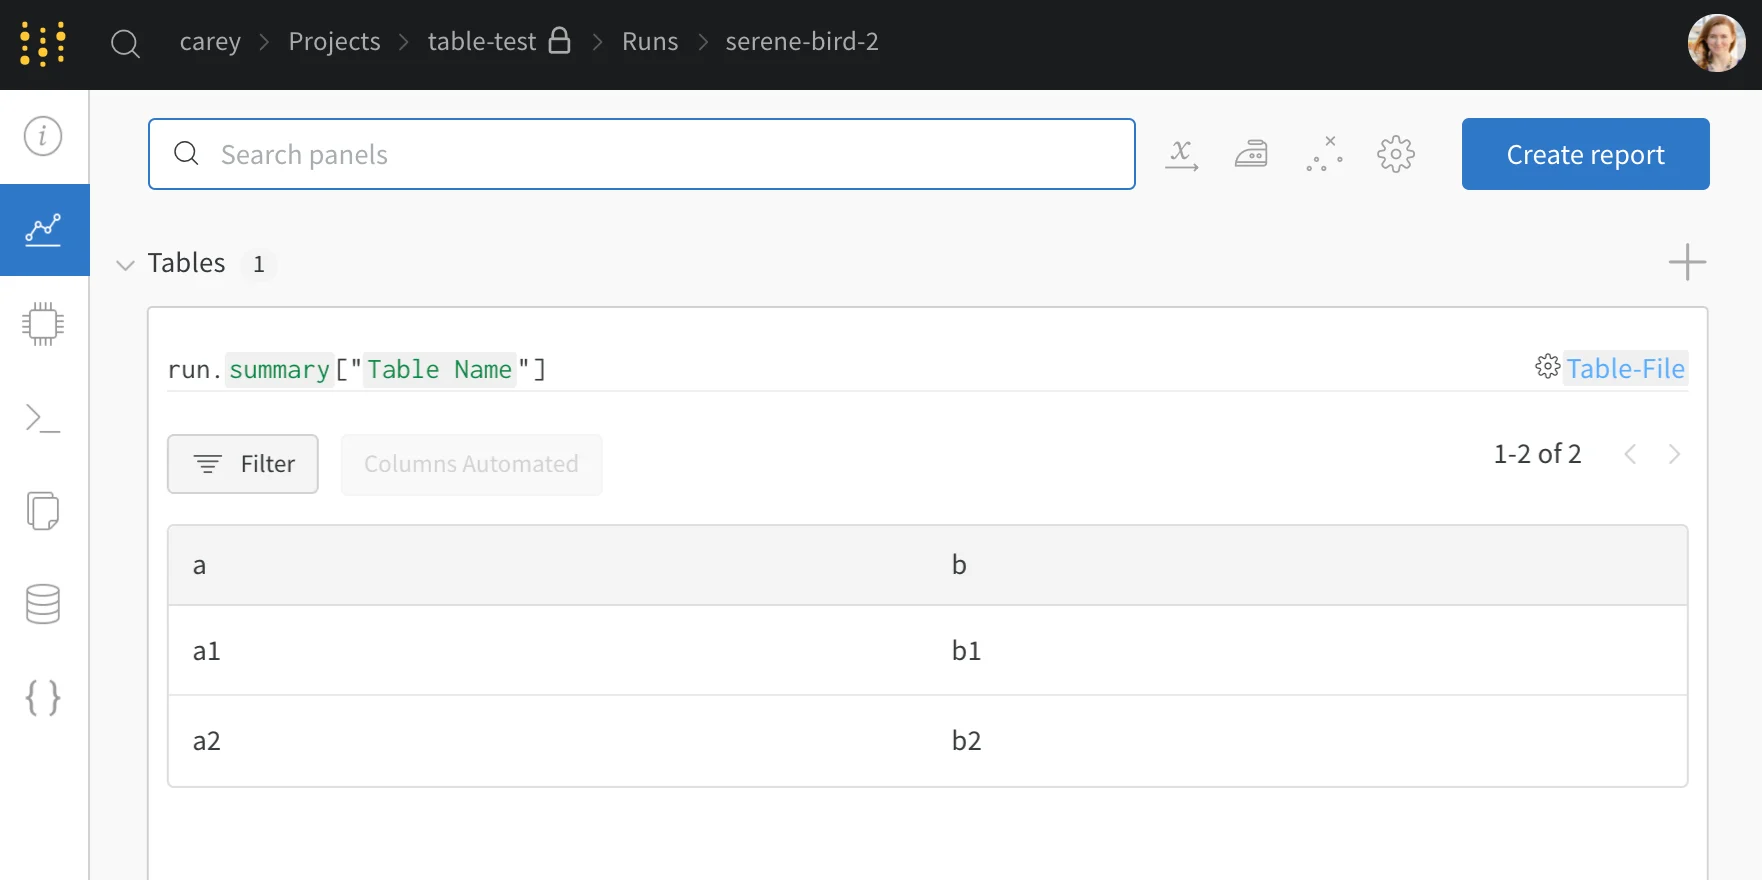
2. Select the name of your run in your project workspace. W\&B adds a new panel for each unique table key.
In this example, `my_table` is logged under the key `"Table Name"`.
## Compare across model versions
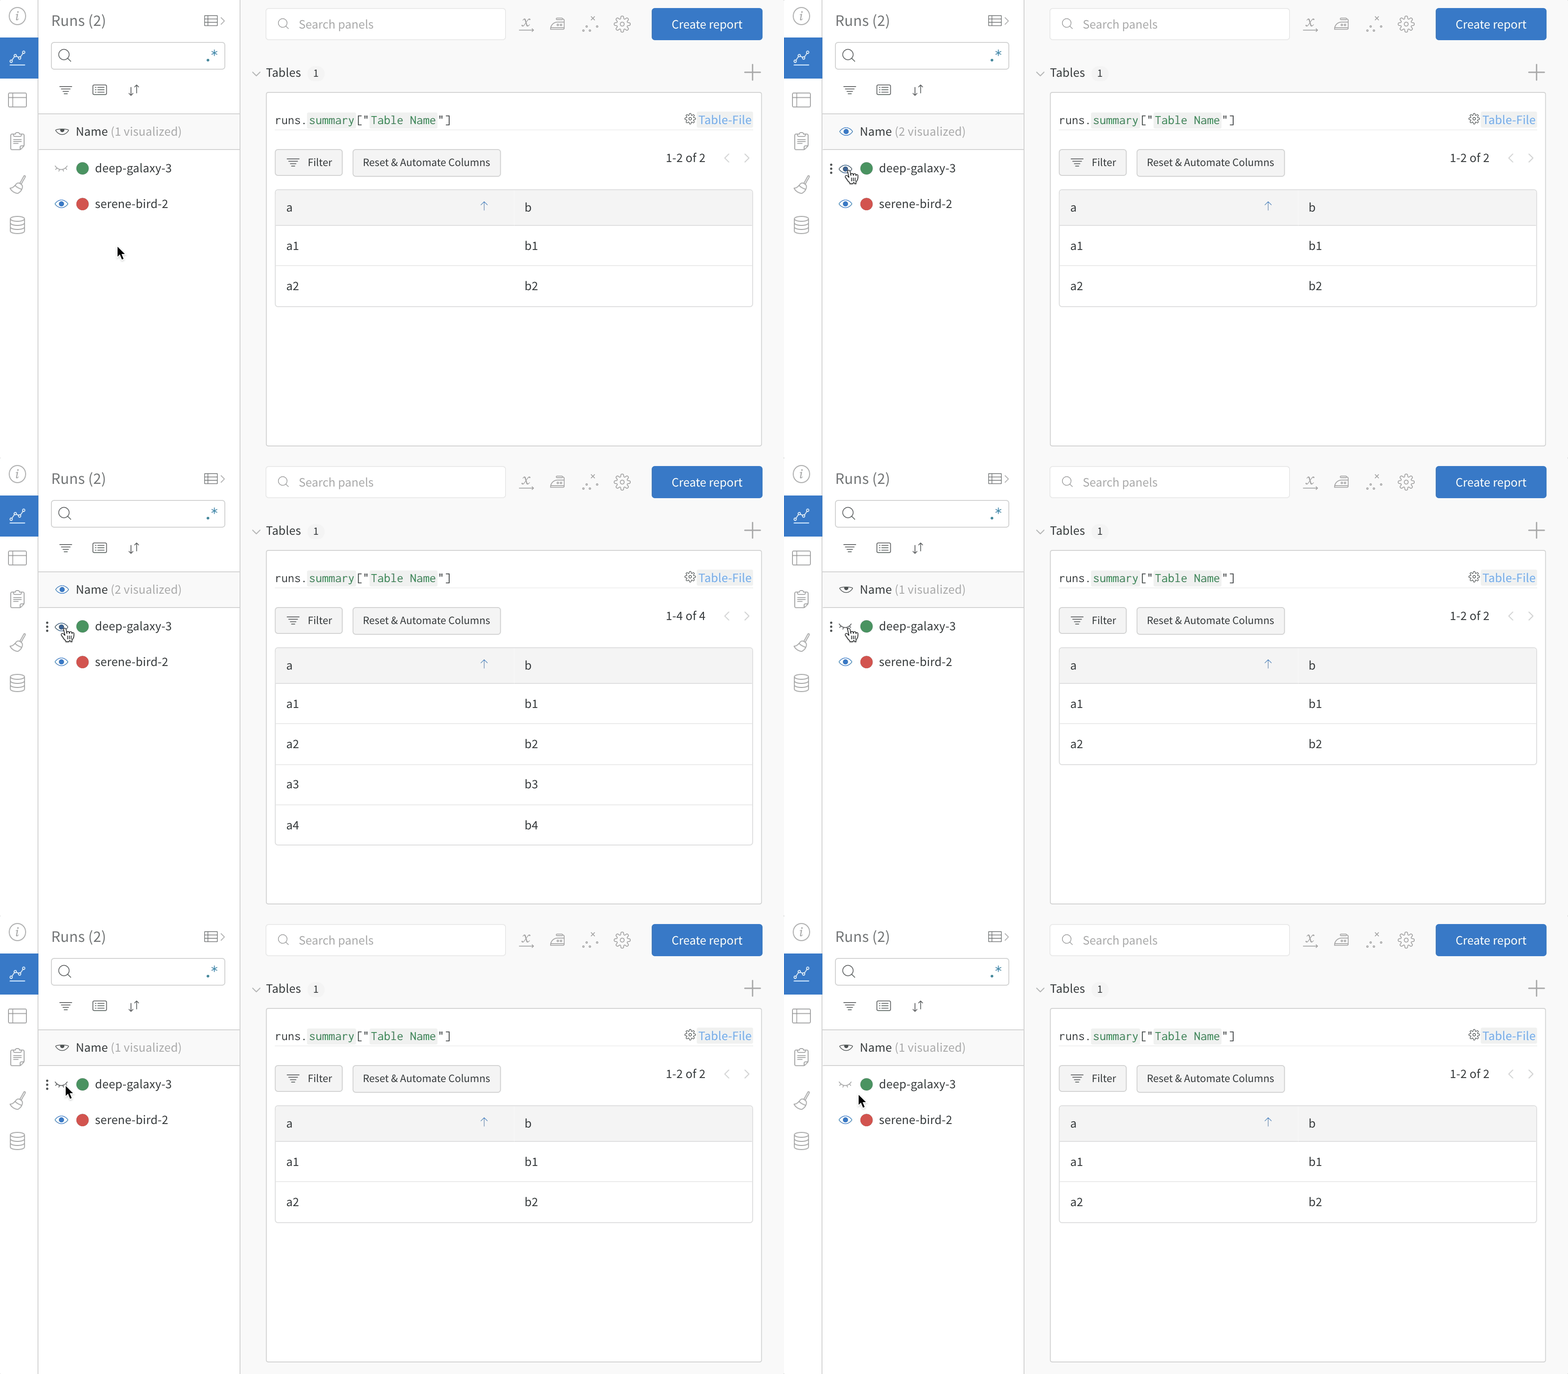
After you have logged tables from more than one run, you can use the project workspace to compare results side by side and evaluate how model versions differ.
After you log tables from multiple W\&B runs, compare results side by side in the project workspace to evaluate differences between model versions. This [example workspace](https://wandb.ai/carey/table-test?workspace=user-carey) shows how to combine rows from multiple versions in the same table.
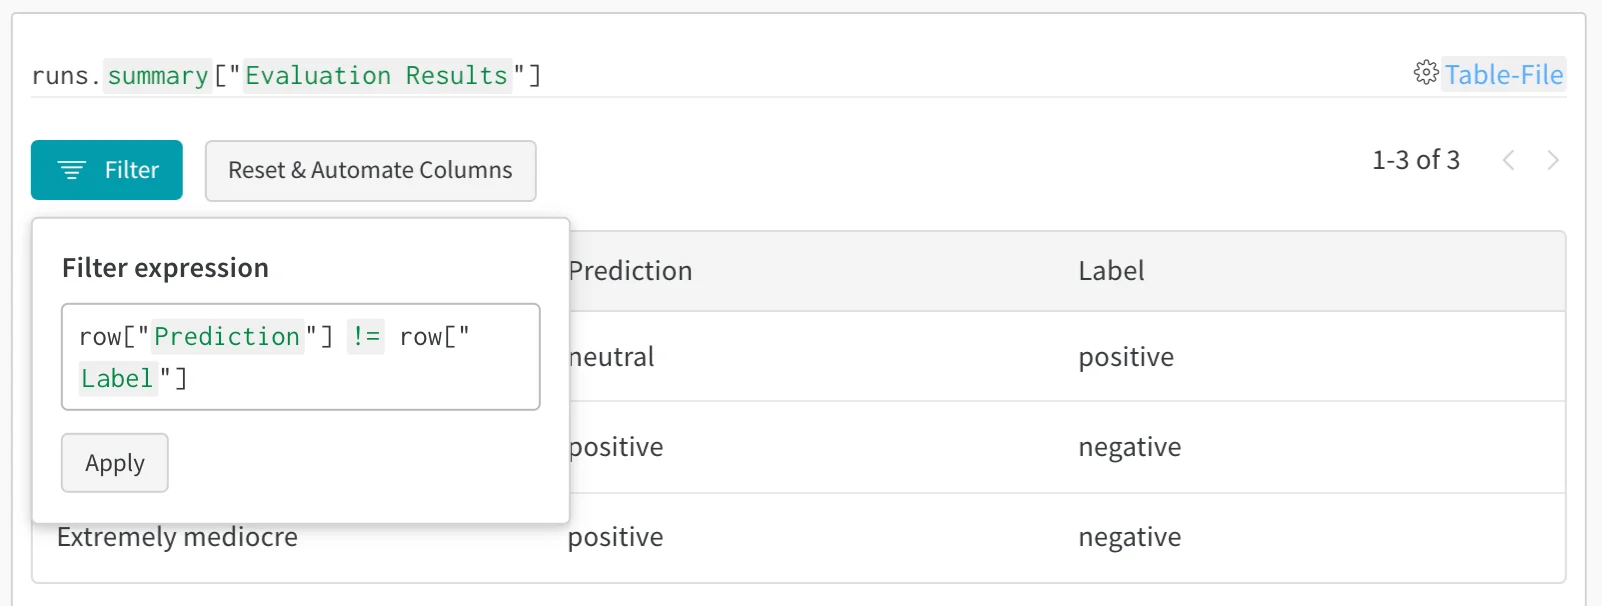
Use the table filter, sort, and grouping features to explore and evaluate model results.
 In this example, `my_table` is logged under the key `"Table Name"`.
## Compare across model versions
After you have logged tables from more than one run, you can use the project workspace to compare results side by side and evaluate how model versions differ.
After you log tables from multiple W\&B runs, compare results side by side in the project workspace to evaluate differences between model versions. This [example workspace](https://wandb.ai/carey/table-test?workspace=user-carey) shows how to combine rows from multiple versions in the same table.
In this example, `my_table` is logged under the key `"Table Name"`.
## Compare across model versions
After you have logged tables from more than one run, you can use the project workspace to compare results side by side and evaluate how model versions differ.
After you log tables from multiple W\&B runs, compare results side by side in the project workspace to evaluate differences between model versions. This [example workspace](https://wandb.ai/carey/table-test?workspace=user-carey) shows how to combine rows from multiple versions in the same table.
 Use the table filter, sort, and grouping features to explore and evaluate model results.